Thursday, November 27, 2008

Cartography (Kartografi)

Cartography (Kartografi)

Cartography (or mapmaking) is the study and practice of making maps or globes.

“Kartografi adalah seni, ilmu pengetahuan dan teknologi tentang pembuatan peta, sekaligus mencakup studinya sebagai dokumen-dokumen ilmiah dan hasil karya seni.” (ICA, 1973)

ICA : International Cartograph Assosiation merupakan asosiasi atau perkumpulan kartografer sedunia...

Obyek-obyek di muka bumi digambarkan dalam bentuk titik, garis, dan area serta warna. Gradasi warna, ukuran titik, dan ketebalan garis menggambarkan kualitas fenomena atau obyek tersebut.

digambarkan ke dalam sebuah "PETA"

Peta adalah suatu gambaran sebagian atau seluruh wilayah permukaan bumi dengan berbagai fenomena kenampakannya pada suatu bidang datar yang diperkecil menggunakan skala tertentu.

Peta menurut International Cartografhic Association adalah: Gambaran unsur unsur permukaan bumi atau ang adakaitannya dengan permukaan bumi maupun benda benda angkasa.

Peta adalah gambaran permukaan bumi pada bidang datar dengan skala tertentu melalui
suatu sistem proyeksi.

Peta mulai ada dan digunakan manusia, sejak manusia melakukan penjelajahan dan penelitian. Walaupun masih dalam bentuk yang sangat sederhana yaitu dalam bentuk sketsa mengenai lokasi suatu tempat.

Pada awal abad ke 2 (87M -150M), Claudius Ptolomaeus mengemukakan mengenai pentingnya peta. Kumpulan dari peta-peta karya Claudius Ptolomaeus dibukukan dan diberi nama “Atlas Ptolomaeus”. Ilmu yang membahas mengenai peta adalah kartografi.


Claudius Ptolemaeus (bahasa Yunani: Κλαύδιος Πτολεμαῖος; 90 – 168), adalah seorang ahli geografi, astronom, dan astrolog yang hidup pada jaman Helenistik di provinsi Romawi, Aegyptus.

sumber: dari berbagai sumber..

best regards,
Aji Putra Perdana

Wednesday, November 26, 2008

Penginderaan Jauh Kelautan - suhu permukaan laut

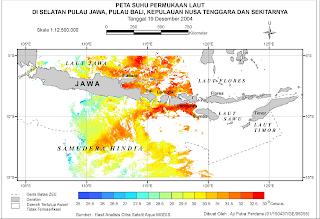
Berikut sekedar sharing tulisan yang tertulis di skripsi KAJIAN SUHU PERMUKAAN LAUT
BERDASARKAN ANALISIS DATA PENGINDERAAN JAUH DAN DATA ARGO FLOAT DI SELATAN PULAU JAWA, PULAU BALI DAN KEPULAUAN NUSA TENGGARA.
-------------------------------------------------------------------------------
aji skripsi
-------------------------------------------------------------------------------------
--------------------------------------------------------------------------------
Perkembangan cepat teknologi penginderaan jauh (remote sensing) menjadikannya sebagai metodologi survey mutakhir yang secara kontinyu dapat dimanfaatkan untuk menyajikan kondisi laut dengan akurat secara ruang dan waktu. Saat ini banyak citra penginderaan jauh yang dapat dimanfaatkan untuk aplikasi kelautan terutama lapisan permukaan laut, diantaranya ialah NOAA- AVHRR (National Oceanic and Atmospheric Administration - Advanced Very High Resolution Radiometer) dan Aqua MODIS (Aqua - Moderate Resolution Imaging Spectroradiometer).

Stasiun bumi NOAA menerima data AVHRR dari satelit dalam bentuk data mentah yang dikenal dengan data HRPT (High Resolution Picture Transmission) secara rutin 2 – 4 kali/hari. Oleh karena itu, siklus harian NOAA cukup baik untuk mengamati perubahan yang terjadi di laut dengan resolusi spasial yang terbatas mencapai 1,1 km. Cakupan citranya cukup luas dengan lebar pandang mencapai 2399 km pada setiap citra global yang dihasilkan.

Data MODIS memiliki resolusi temporal 1-2 hari dan data dapat diperoleh melalui download dalam format data HDF (Hierarchical Data Format). Resolusi spasial dari 250 m (band 1-2), 500 m (band 3-7), dan 1 km (band 8-36) dengan cakupan citra mencapai 2330 km.

Saluran-saluran radiasi inframerah termal dari NOAA-AVHRR dan Aqua MODIS, berfungsi untuk mendeteksi radiasi termal yang dipancarkan oleh permukaan bumi. Berdasarkan hubungan antara suhu dengan intensitas emisi maka data AVHRR dan MODIS dapat dimanfaatkan untuk mengukur suhu permukaan laut.

Suhu permukaan laut merupakan parameter yang berkaitan dengan berbagai fenomena laut, sehingga dapat digunakan untuk mengidentifikasi daerah upwelling, front, arus laut, arus eddie, daerah konsentrasi ikan dan kemungkinan kandungan mineral (Medellu, 1986). Selain itu, data suhu permukaan laut amat penting untuk mengetahui keseimbangan laut dan atmosfer dari waktu ke waktu (Constan et al., 1983 dalam Medellu, 1986).

------------------------------------------------------------------------------------
Citra merupakan gambaran visual tenaga yang direkam dengan menggunakan piranti penginderaan jauh (Ford, 1979, dalam Sutanto, 1986).

Oseanografi dapat didefinisikan secara sederhana sebagai suatu ilmu yang mempelajari lautan (Hutabarat dan Evans, 1985).

Remote Sensing biasa juga disebut sistem penginderaan jauh merupakan suatu teknologi yang memanfaatkan gelombang elektromagnetik untuk mendeteksi dan mengetahui karakteristik objek di permukaan bumi, baik daratan maupun permukaan laut dan perairan tanpa melakukan kontak langsung dengan objek yang diteliti tersebut (Lillesand dan Kiefer, 1979).

Suhu adalah ukuran energi gerakan molekul (Paena, M., 2002).

--------------------------------------------------------------------------------------

Salam Penginderaan Jauh untuk Kelautan bagi Indonesia tercinta...

Aji Putra Perdana


*to be continued......

Tuesday, November 25, 2008

Pelatihan Aplikasi GPS

GPS (Global Positioning System)

GPS adalah sistem satelit navigasi dan penentuan posisi yang dikembangkan dan dikelola Departemen Pertahanan Amerika Serikat.

Nama Formal NAVSTAR – GPS : NAVigation System for Timing and Ranging Global Positioning System

Didesain untuk:
-informasi waktu
-posisi dan kecepatan tiga dimensi

Pelatihan Aplikasi GPS merupakan pelatihan pemanfaatan teknologi GPS dan integrasinya dengan GIS (Geographic Information System).
Aplikasi GPS telah digunakan oleh berbagai kalangan diantaranya organisasi-organisasi non pemerintah (LSM/Ornop)/NGO Lokal maupun Internasional sebagai alat bantu dalam kegiatannya. Misalnya, pemetaan partisipatif, siaga/mitigasi bencana, kajian degradasi lingkungan, pemantauan kebakaran hutan, jaringan penyelamatan hutan, pertanian, perkebunan, perikanan, pengelolaan pesisir kelautan, survey dan pendataan di bidang kesehatan, pendidikan, pemetaan budaya (arkeologi) dan lainnya.

---
KONTAK GEOVISI :
PT. GEOVISI MITRATAMA
Web : http://geovisi.com

ODV Petunjuk Pengolahan untuk Data Argo Float

Assalamu'alaikum
selamat pagi
ini sekedar re-posting dari petunjuk ODV yang sudah kuposting sebelumnya dan dari postingan ocean data view

--------------------------------------------------------------------
apa itu ODV???
ku tau ODV sewaktu ikut pelatihan pengolahan data argo float dan aqua modis di seacorm..
thanks alot to pak realino dan pak widodo s pranowo
ku ga tau banyak apa itu ODV...so ini sekedar tulisan ae,,,hehe
temen2 di oseanografi mungkin lebih banyak tau,terlebih yang udah biasa menggunakan, palagi buat tugas akhir/skripsinya... :)
-----------------------------------------------------------
download skripsiku : aji skripsi
------------------------------------------------------------
Ocean Data View (ODV) is a software package for the interactive exploration, analysis and visualization of oceanographic and other geo-referenced profile or sequence data. ODV runs on Windows (9x, Me, NT, 2000, XP), Mac OS X, Linux, and UNIX (Solaris, Irix, AIX) systems. ODV data and configuration files are platform-independent and can be exchanged between different systems.

Use ODV to produce:
* property/property plots of selected stations
* scatter plots for sets of stations
* color sections along arbitrary cruise tracks
* color distributions on general isosurfaces
* temporal evolution plots of tracer fields
* differences of tracer fields between repeats
* geostrophic velocity sections
* animations

ku menggunakan ODV untuk pengolahan data argo float. actually, ku menggunakannya cuma untuk aplikasi yang sederhana. cuma membaca data argo float, sehingga dapat di tampilkan profil suhu dan salinitas yang terekam di argo float. selain itu untuk menampilkan secara spasialnya, dikemaslah ke dalam iso-surface berdasarkan suhu lapisan teratas yang terekam oleh data argo float.

ODV mendukung untuk membaca format netCDF. format yang digunakan oleh argo float.
seneng euy bisa ketemu ma ODV...coz ku bisa olah argo float dech.dulu awalny masih bingung, mau kuapakan tuch data argo float. cara yang dulu kupake, ke download gambar profil argo dalam format jpeg. yang kedua, pake software apa gitu (ku lupa namany..), disarankan juga pake matlab (kagak tau euy..), eh disarankan pake ODV. cari dech di internet, download, dan pelajari, trs dipake dech,,,hehe.

ku buat iso-surface dengan VG-Gridding, eh pas tadi liat2 lagi. ada DIVA-Gridding..(bukan 3DIVA...hehe). dulu adanya Quick dan VG, sekarang ada DIVA.DIVA dikembangkan oleh University of Liege.

pengin tau lebih, dateng aja ke situsnya ODV http://odv.awi.de


----------------------------------------------------------------------------------
Alkisah lain dan berikutnya :
------------------------------------------------------------------------------
kemarin2 aku dapat email dari seorang temen, so terinspirasi untuk sekedar berbagi apa yang bisa dibagi.. :)
bercerita tentang ocean data view dan argo float serasa mengenang masa-masa skripsi..

Berikut cuplikan langkah-langkah pengolahan argo float menggunakan Ocean Data View:

1. pertama-tama jalankan software ODV
2. kemudian akan muncul tampilan awal ODV


3. Buatlah data koleksi baru ODV, pilih File -> New atau tekan tombol Ctrl + N. dan pilih lokasi penyimpanan file tersebut.
4. Kemudian pilihlah ARGO profile variables.


5. Selanjutnya, import data argo float dengan pilih import - ARGO Formats - Float Properties (NetCDF..) - Single File


6. maka akan muncul peta yang berisi titik2 yang menunjukkan lokasi argo float. untuk menampilkan profilnya klik di argo float yang ingin ditampilkan datanya.
7. berikut contoh profil temperatur data argo float yang ada dilampirkan dalam skripsiku.


tulisan sederhana ini mengenai petunjuk pengolahan data argo float dengan menggunakan software ocean data view (ODV). sekiranya dapat bermanfaat bagi temen2..
kebetulan kemarin ada temen yang bertanya, sekiranya dapat membantu..
banyak informasi di dunia maya ini...pergunakanlah untuk menambah ilmu pengetahuan kita..

let's learn together..keep spirit and study :)

thanks to pak widodo s pranowo for visiting my blog..
sehinga ku semakin bertambah semangatnya tuk terus belajar dan belajar,,, :)

argo float and ODV user...
di jogja berhati nyaman ...

-------------------------------------------------------------------------------------

Re-posting dua tulisan di atas, adalah apresiasi untuk Pak Widodo S Pranowo yang telah berbagi ilmunya mengenai Argo Float dan Pengolahan Data Argo Float (dengan Ocean Data View)

Meskipun dulu awalnya memang benar-benar kubingung mau mengolahnya menggunakan software apa...

Selain itu re-posting mengenai pengolahan data argo float menggunakan ocean data view sekiranya bisa membantu teman-teman untuk lebih melakukan eksplorasi dalam riset ataupun penelitian yang memanfaatkan data-data oceanography...

anyway....argo float kini udah mencapai 3000an lebih float yang mengapung di perairan di seluruh dunia...
---------------------------------------------------------------------------------------

Salam,

Aji Putra Perdana

Monday, November 24, 2008

ARCGIS Data Interopability

ARCGIS Data Interopability sebuah ekstensi yang luar biasa, muncul di ArcGIS 9.2 (kalo tidak salah..mohon koreksinya),,,
ArcGIS Data Interopability menghancurkan tembok pembatas layaknya dinding-dinding yang menjadi sekat pembatas akses data langsung, transformasi data, dan kemampuan export data.
---------------------------------------------
Apa itu Interoperability : http://en.wikipedia.org/wiki/Interoperability
---------------------------------------------
ArcGIS mengeluarkan ekstensi ARCGIS Data Interopability ini membantu pengguna ArcGIS Desktop sehingga mudah dalam penggunaan dan distribusi data dalam berbagai format.
Dengan ArcGIS Data Interopability kita dapat secara langsung lebih dari 75 format data spasial, ekxport ke lebih dari 50 format data spasial, penggunaan semantic data translation engine dengan 150 transformer khusus, integrasi dengan geoprocessing termasuk Model Builder untuk menambahkan manipulasi format data dalam pemodelan GIS.
Berikut ada :
Summary supported format di ArcGIS Data Interopability
dalam format pdf berisi format data yang didukung di ArcGIS Data Interopability.
---------------------------------------------------------------------------

Gambar di atas ku cuplik2 dan gabung-gabung.. :)
---------------------------------------------------------------------------------
Menggunakan Tools Ekstensi Data Interopability
Using the Data Interoperability Extension tools
These tools can be organized into three functional areas:
Direct read tools
- Direct Read
The simplest way to directly read non-ESRI data formats is by browsing to the datasets in the Catalog Tree. This ability only requires that the Data Interoperability Extension is enabled. This user experience is similar to browsing for ESRI data formats. The representation of the data will depend on the format - some will posses containers with feature classes and others will be single files.

Kita bisa melihat berbagai format data spasial melalui ArcCatalog Tree..
Bisa juga kita mengakses format data non-ESRI dari ArcMap lewat Add Data

- Interoperability Connections
Metode lain untuk membaca data non-ESRI ialah dengan menggunakan Interoperability Connections tool.

This tool provides a more robust method for directly reading your data sources. It allows you to make a connection to a data source or a collection of data sources.
Once the connection is made, data sources will appear underneath the Interoperability Connection tree and are available for use.

Here are some reasons why you may want to use an Interoperability Connection:
* Maintain database connections
* View formats with non-standard file extensions that not be recognized by the Catalog Tree
* Aggregate many tiles of data
* Add formats that require parameters like usernames and passwords
* Specify the coordinate system

Quick conversion tools
The Data Interoperability Extension provides the following tools to quickly convert data: Quick Import and Quick Export. These tools are intended for simple data translations - where the number of input features will match the number of output features. In other words, it is a one to one translation (i.e., flat conversion).
These tools do not require a lot of preparation, so they are ideal for scenarios where you need to convert data quickly. Both of these tools can be incorporated in a Geoprocessing model or script. This allows you to combine the conversion with other Geoprocessing operations. It is important to note that Quick Import and Quick Export will not modify feature geometry or schemas during the conversion.

Quick Import
The Quick Import tool allows you to convert input data formats to a geodatabase. Quick Import is a geoprocessing tool and resides in the Data Interoperability Tools toolbox. Double clicking the tool will open the Quick Import dialog box which will allow you to specify an input data and output staging geodatabase that will define the translation.

Quick Export
The Quick Export tool allows you to convert layers to an output dataset. Like Quick Import, Quick Export is also a geoprocessing tool that resides in the Data Interoperability Tools toolbox. Double clicking the tool will open the Quick Export dialog box which will allow you to specify input layer(s) and an output dataset.

Data transformation tools
Data transformation tools are used to manipulate and transform data. They can perform both schema and geometric restructuring as you convert data to a new output data source. For example, you can add, remove or rename attributes, and calculate or assign values to new or existing attributes. These tools allow you to integrate complex data model restructuring within the geoprocessing environment.
The Workbench application is included with the ArcGIS Data Interoperability extension. This application is a visual diagramming environment that supports dozens of transformers that enable you to transform both geographic and attribute information. You can use the Workbench application to create custom data tools for transforming data as you create new data sources and create custom formats to transform data on-the-fly. These tools use Safe Software's feature manipulation language of their Feature Manipulation Engine (FME). They allow for schema redefinitions and give the user full control of the data translation and transformation process.
Spatial ETL
The Spatial ETL tool provides data transformation capabilities within the geoprocessing environment. It replaces the three custom tools (Custom Data Import, Custom Data Export, and Custom Data Transformation) that were available in previous versions of ArcGIS 9.x. Therefore, it can be used for importing, exporting, and transforming data. Spatial ETL now provides a single tool for all of your data transformation workflows.


source : ArcGIS Dekstop Help, http://www.esri.com/software/arcgis/extensions/datainteroperability/index.html, http://myesri.blogspot.com/2006/07/arcgis-data-interoperability.html, http://en.wikipedia.org/wiki/Spatial_ETL,http://en.wikipedia.org/wiki/Interoperability

Spatial and Non-Spatial Regards...

Aji Putra Perdana

Wednesday, November 19, 2008

ArcGIS Model Builder

An overview of ModelBuilder

ArcGIS Model Builder

ModelBuilder is an application in which you create, edit, and manage models. If you haven't done so already, you should read Creating a simple model, for it shows you, by example, the basic tasks of creating a model in ModelBuilder. You should also read An overview of model concepts and terms and the topics referenced there, since they define many of the terms used here.

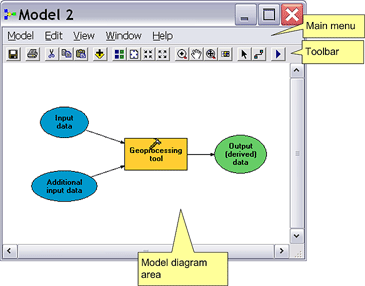
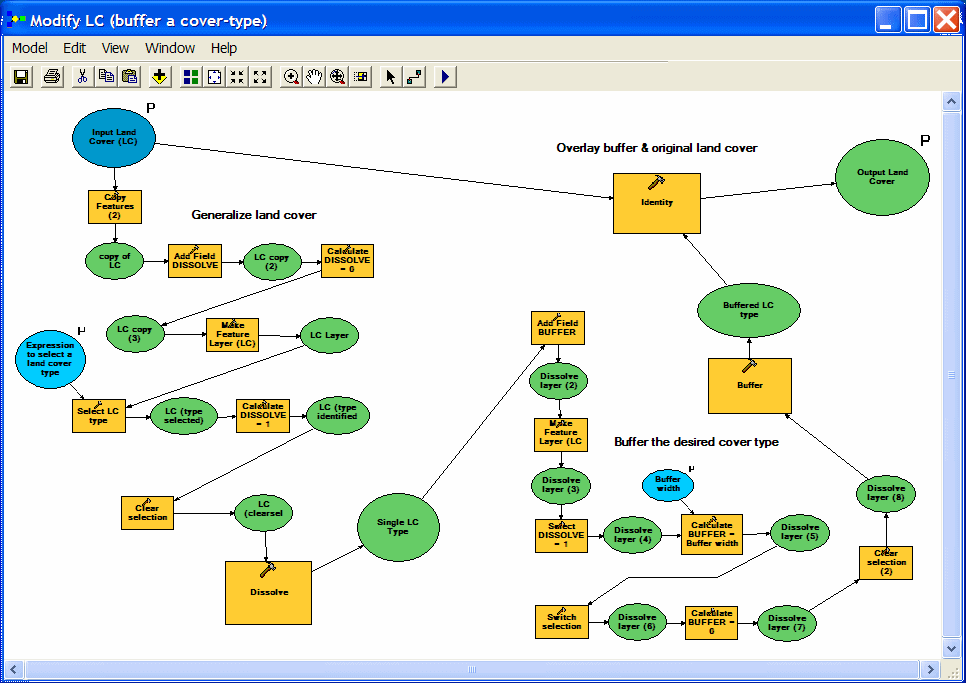
The components of the ModelBuilder application are shown below.


There are five pull-down menus on the Main menu.


The toolbar has the following buttons and tools:


Read a synopsis of this toolbar

* The Add Data or Tool button is discussed in Creating model processes.
* Navigation tools are discussed in Navigating a model.
* Select Element allows you to select an element for moving, copying, accessing properties, and deleting.
* The Connect tool connects elements, such as a data variable to a tool, and is discussed in Creating model processes.
* The Run button runs the model and is discussed in Running a model.


You cannot customize this toolbar.

The topics that follow discuss the use of ModelBuilder and the mechanics of creating, editing, and managing models.


Model building approaches discusses the two basic approaches to model building.

When you build a model, you create processes (a process is a tool plus its data) and the connections between them, and Creating model processes shows you how.

You can run your models within ModelBuilder, or execute them like any other tool using the tool dialog or the Command Line window. Running a model shows you how to run models within ModelBuilder.

Validating a model shows you how to check your model for errors and to synchronize data variables.

Model environments discusses the use of geoprocessing environment variables and how they can be used in models.

Model appearance shows how you can change the look and arrangement of model elements to increase readability.

You can print a model diagram (Printing a model), generate and print a report (Model reporting), and export a model to a script (Exporting a model).

Model documentation is very important for sharing models. Documenting a process shows how to provide documentation for individual model processes.

-------- source information : http://webhelp.esri.com/arcgisdesktop/9.2/index.cfm?TopicName=An_overview_of_ModelBuilder

*******************************************************************
ArcGIS Model Builder :
Terrain Analysis using Model Builder

Prepared by David R. Maidment and David G. Tarboton
Fall 2004

This tutorial shows how to solve a simple terrain processing and hydrologic analysis problem using the ArcGIS Model Builder to develop an automated workflow sequence. The input data are two small grids that can be typed in a word processor elev.txt and rain.txt. These grids contain a 6-line header file which defines the number of rows and columns, the coordinates of the lower left corner, the cellsize and the value for cells which have no real data in them. Then the data values follow in row-column format. All dimensions of the terrain grid are in meters and the rainfall is in mm.


========================================================================================
ArcGIS Model Builder
Local Examples of ArcGIS 9 Model Builder

VSDP Roundtable
13 July 2005


1. Montpelier Development Potential
Daniel Currier, Central Vermont Regional Planning Commission
http://www.centralvtplanning.com/

2. Natural Lands Trust Green Plan 2005
David Felcan, Avencia Incorporated
http://www.avencia.com/

3. Species Habitat Modeling
Ernest Buford, UVM Spatial Analysis Laboratory
http://www.uvm.edu/envnr/sal/

------------------------------------------------------------------------------------
ArcGIS Model Builder
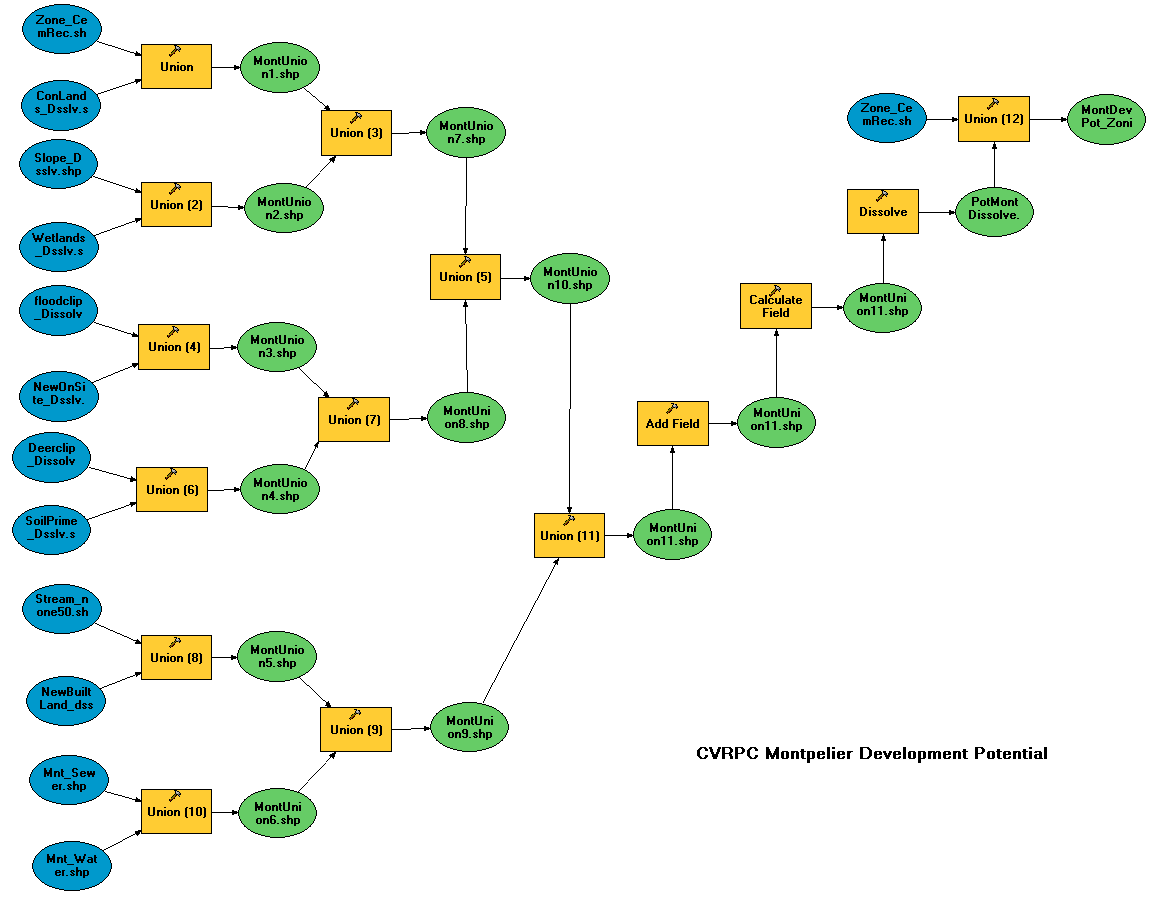
Montpelier Development Potential Model

CVRPC used this model to analyze development potential in the town
of Montpelier. The model basically performs many unions to overlay
eleven input layers that have all been scored according to their effect
on development potential.

-------------------------------------------------------------------------------------
ArcGIS Model Builder
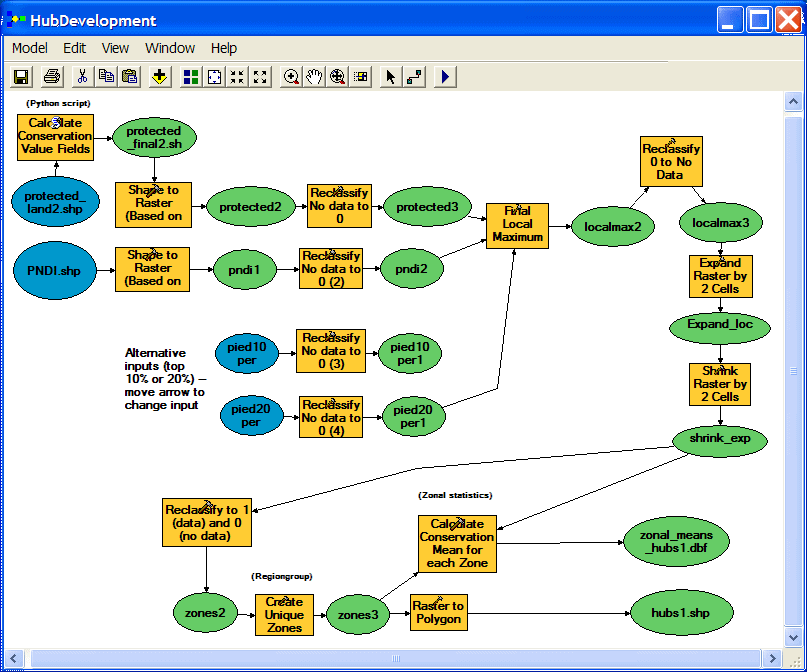
National Lands Trust Green Plan Model

The NTL Green Plan model combines several protected lands layers (polygon shapefiles)
into a single protected lands layer and performs an analysis that is used to identify
"hubs" of protected land that might serve as the core areas of a more well-connected
network of protected land.


-------------------------------------------------------------------------------------
ArcGIS Model Builder
Species Distribution Modeling

One common way to create predicted distribution maps for animals is to
reclassify a land cover layer according to whether or not the species in
question would be predicted to use each cover type. These simple species
maps are often modified by using range data or such ancillary information as
elevation or distance to water. The Spatial Analysis Lab has done several
projects using this type of technique.


==============================================================================

ArcGIS Model Builder

bEST ReGards,

Aji Putra Perdana
- free gis'er -

Salam SPaSial dan NoN sPasiAL

Sunday, November 16, 2008

Argo Float, Aqua MODIS,NOAA-AVHRR, ODV, SeaDAS

Lama kutidak melihat Argo Float...Sebuah intrumen yang membuatku bisa lolos, eh lulus dan dinyatakan sebagai Sarjana Fakultas Geografi UGM. Jurusan Kartografi dan Penginderaan Jauh,,,tidak kusangka kalau aku akhirnya masuk ke Jurusan tersebut..berbekal nilai Fotogrametri yang saat itu belum keluar-keluar (seharusnya kudapat B, dengan bermodal awal nilai C)..anyway thanks to Bapak Dosen yang mengajar Fotri.

Apa itu Argo Float??
Pada awalnya ku bener-bener tidak tahu tentang Argo Float, sampai sekarangpun belum pernah melihat langsung float tersebut.,.hehe
cuman melihat dari gambar dan video peluncuran Argo Float,,
Wikipidea..juga menuliskan apa itu Argo
Argo is an observation system for the Earth's oceans that provides real-time data for use in climate, weather, oceanographic and fisheries research.[1] [2] [3] Argo consists of a large collection of small, drifting oceanic robotic probes deployed worldwide. The probes float as deep as 2 km. Once every 10 days, the probes surface, measuring conductivity and temperature profiles to the surface. From these salinity and density can be calculated. The data are transmitted to scientists on shore via satellite. The data collected are freely available to everyone, without restrictions. The initial project goal was to deploy 3,000 probes, completed in November 2007.

What is Argo?

Argo is a global array of 3,000 free-drifting profiling floats that measures the temperature and salinity of the upper 2000 m of the ocean. This allows, for the first time, continuous monitoring of the temperature, salinity, and velocity of the upper ocean, with all data being relayed and made publicly available within hours after collection.

Setelah melihat situsnya http://www-argo.ucsd.edu/

Sekarang jumlah Argo Float yang mengapung di kedalaman sekitar 2000an meter dan muncul ke permukaan untuk sekedar mengirimkan data yang direkamnya saat dia naik ke permukaan.

Kelangkaan data observasi yang berkesinambungan dari atmosphere, ocean dan daratan untuk pemodelan iklim merupakan alasan dibutuhkannya data dari Argo Float..
Argo Float diharapkan dapat memberikan gambaran observasi kelautan untuk menggambarkan kondisi suhu dan salinitas secara kontinyu.

Who Collaborates with Argo?
Argo is a major contributor to the WCRP's Climate Variability and Predictability Experiment (CLIVAR) project and to the Global Ocean Data Assimilation Experiment (GODAE). The Argo array is part of the Global Climate Observing System/Global Ocean Observing System GCOS/ GOOS).

-----------
AVISO
Data Argo Float dicek dengan data altimetri...http://ajiputrap.blogspot.com/2008/10/argo-float-altimetry.html

------------------------------------------------------------------------------------

tertarik untuk membaca-baca aplikasi Argo Float dan Data Citra Satelit Penginderaan Jauh Resolusi Rendah yakni citra NOAA-AVHRR dan citra Aqua MODIS dikaji untuk suhu permukaan laut di Samudera Hindia, Pengolahan Argo Float yang mempunyai format data NetCDF menggunakan Ocean Data View (ODV), Pengolahan citra Aqua MODIS dengan SeaDAS???

Beberapa link tentang Argo Float:
http://ajiputrap.blogspot.com/sst-argo.html
http://www.argo.ucsd.edu/FrComplete_float_bib.html

Pengolahan Data Argo Float (yang berformat NetCDF) dengan Ocean Data View :
http://ajiputrap.blogspot.com/2007/07/about-argo-float-2.html
http://ajiputrap.blogspot.com/2008/05/ocean-data-view.html
Langkah-langkah pengolahan data (NetCDF) Argo Float untuk ekstraksi suhu dan salinitas:
http://ajiputrap.blogspot.com/petunjuk-ODV.html
------------------------------------------------------
tentang SeaDAS untuk MODIS: http://ajiputrap.blogspot.com/search/label/SeaDAS

Untuk membaca-baca tulisan tentang Argo Float dan Data Penginderaan Jauh :
Silahkan mengunduh skripsinya download SKRIPSI AJI


Salam,

Aji Putra Perdana
- free gis'er and raster's -

Thursday, November 13, 2008

ASAP Utilities for Exel User


“The essential add-in for Excel users”
ASAP Utilities is a powerful Excel add-in that fills the gaps in Excel and automates frequently used tasks. Since 1999 it has grown to become probably one of the world's most popular add-ins for MS Excel.
A must in every office
In my humble opinion I believe this excel software utility is a must in every office. I use it myself on a daily basis and it saves me (and many others) an incredible amount of time. At this moment there are about 100.000 satisfied users worldwide!
“We make you the company's Excel guru!”
Save time in Excel with these popular tools
A few of ASAP Utilities' popular macro tools that will speed up your work in Excel:

* Deselect cells in your selection | video
* Apply formula to selected cells | video
* Conditional select cells: for example select cells greater than 12 or all red cells
* Advanced sorting: for example sort by color | video
* Copy a worksheet's page and print settings
* Vision control: view workbooks, sheets and easily change their settings
* Print multiple sheets
* Color each n'th row or column in selection (color banding)
* File import and export (txt, csv, dbf, xls, gif, jpg, etc.)
* Export selection as HTML table (including formats, colors etc.)
* Assign your own shortcuts to the utilities you use the most
* More: list of all utilities and extra worksheet functions

Download
Download the latest version, date September 23, 2008.
ASAP Utilities installs and upgrades easily and creates its own submenu in Excel next to the help-button. If you use ASAP Utilities in a commercial organization you are allowed to try it for 90 days. If you like it and continue to use it, simply purchase a license key.

-------------------

ASAP Utilities membantuku..bermain-main dengan exel.,..hehe

day by day is exel day...


salam,

Aji Putra Perdana
- exel user -