Showing posts with label SeaWIFS. Show all posts

Thursday, December 9, 2010

Bakar Hutan versus Hijaunya Vegetasi

Bakar Hutan versus Hijaunya Vegetasi

Tulisan kali ini mencoba menatap secara global aktivitas pembakaran karena di permukaan bumi ini "something is always burning".

Peta api di bawah ini menunjukkan lokasi kebakaran aktif yang terbakar di seluruh dunia setiap bulannya, berdasarkan pengamatan dari citra Moderate Resolution Imaging Spectroradiometer (MODIS) yang terpasang pada satelit Terra milik NASA.

Warna didasarkan pada penghitungan jumlah (bukan ukuran) dari kebakaran yang diamati dalam wilayah 1.000 kilometer persegi. Piksel Putih menunjukkan nilai tertinggi dari-hitungan sebanyak 100 kebakaran di area 1.000 kilometer persegi per hari.
Piksel Kuning menunjukkan sebanyak 10 kebakaran, oranye menunjukkan sebanyak 5 kebakaran, dan daerah merah sesedikitnya 1 api per hari.

Beberapa pola global yang muncul dalam peta api dari waktu ke waktu adalah hasil dari siklus alami dari curah hujan, kekeringan, dan petir.

Misalnya, kebakaran yang terjadi secara alami yang umum di hutan utara Kanada pada musim panas. Di bagian lain dunia, pola-pola merupakan hasil dari aktivitas manusia. Misalnya, pembakaran intens di jantung Amerika Selatan dari Agustus-Oktober adalah hasil dari kebakaran manusia-dipicu, baik disengaja dan tidak disengaja, di Amazon Rainforest dan Cerrado (sebuah padang rumput / ekosistem savana) ke selatan. Di seluruh Afrika, sebuah pembakaran pertanian yang meluas menyapu utara ke selatan lebih dari benua sebagai musim kemarau berlangsung setiap tahun. Pembakaran dari aktivitas pertanian terjadi pada akhir musim dingin dan awal musim semi setiap tahun di seluruh Asia Tenggara.


(a)

(b)

Gambar 1. Video (sumber: GlobalMap: Fire NASA) Maret 2000 hingga Oktober 2010 (a) dan Gambar (hasil printscreen) Kebakaran di Permukaan bumi di Bulan Oktober 2010 (b)


Lalu, apa sich yang terbakar ? Apakah benar vegetasi yang terbakar dan bagaiman kehijaun vegetasi dari pantauan MODIS Terra juga ?

Mari kita bandingkan video dan gambar kebakaran api (memerahnya bumi) dengan kehijauan vegetasi (menghijaunya bumi).

Pada peta di bawah ini, vegetasi ini digambarkan dalam skala, atau indeks, dari kehijauan (menggunakan NDVI). Kehijauan didasarkan pada beberapa faktor: jumlah dan jenis tanaman, bagaimana berdaunnya mereka, dan bagaimana sehatnya mereka. Di tempat-tempat di mana dedaunan padat dan tanaman yang tumbuh cepat, indeks tinggi, direpresentasikan dalam warna hijau gelap. Daerah di mana beberapa tanaman tumbuh memiliki indeks vegetasi rendah, ditampilkan dalam cokelat. Area dimana citra satelit tidak mengumpulkan data berwarna abu-abu.

(a)
Gambar 1. Video (sumber: GlobalMap: Vegetation) Maret 2000 hingga Oktober 2010 (a) dan Gambar (hasil printscreen) Kehijauan Vegetasi di Permukaan bumi di Bulan Oktober 2010 (b)


Pilih Bumi berwarna merah atau hijau, dan langit berwarna biru atau kelabu ???
Adakah hubungannya dengan 'perubahan alam' ataukah ada turut andil 'perubahan manusia' juga di dalam merubah warna-warni dunia ???

sumber info+video : GlobalMap: Fire and Vegetation dari earthobservatory NASA

salam 'mejikuhibiniu',

Aji PP

Tuesday, March 31, 2009

SeaDAS for Windows XP and Vista

SeaDAS Virtual Appliance
released for Windows!

SeaDAS VA 5.3b (beta) allows SeaDAS to be run on Microsoft Windows XP and Vista systems within a virtual Linux machine.
This is a fully functional version of SeaDAS and processing benchmarks show very impressive performance.

SeaDAS VA is simple to install and requires the free VMware Player.

SeaDAS VA Screen Shot

Best Regards,

Aji Putra Perdana
http://ajiputrap.blogspot.com/
http://bumiwisata.blogspot.com/

SeaDAS - Level-2 processing MODIS

What is SeaDAS


The SeaWiFS Data Analysis System (SeaDAS) is a comprehensive image analysis package for the processing, display, analysis, and quality control of ocean color data.

SeaDAS Screen Shot

Supported satellite sensors are
MODIS, SeaWiFS, OCTS, and CZCS.

SeaDAS Primary Functionalities

Processing programs:

SeaWiFS:
  • L1A, L1B, L2, L3, and SMI (Standard Mapped Image) processing
  • Map projection of L1, L2, and L3 files
  • L1 and L2 Browse product generation
  • L1A to L0 program for renavigation
  • Interactive L1 coastline registration and L2 QC
  • L1 subscene extraction
  • MODIS:
  • L0 to L1A Direct Broadcast processing
  • L1A Geolocation processing
  • L1A subscene extraction
  • L1A to L1B processing
  • L1B to L2 processing
  • L2 and L3 binning
  • SMI processing
  • Map projection of L2 and L3 files
  • CZCS:
  • L1A to L1B processing
  • L1 to L2 processing
  • L2 and L3 binning
  • SMI processing
  • OCTS:
  • L1A to L1B processing
  • L1B to L2 processing
  • L2 and L3 binning
  • SMI processing


  • SeaDAS Tutorials


    SeaWiFS Data Product Generation Programs:
    l1agen_seawifs Generate L1A file from L0 (HRPT) file
    l1bgen Generate L1B file from L0 (HRPT) file
    l2gen,0 Generate L2 file from L1A (GAC, LAC, HRPT) file
    l2bin/l3bin Generate L3 space- or time-binned files from L2 files
    smigen Generate L3 SMI standard mapped product from L3 binned data
    browse Generate L1A browse (Band 865nm) file or L2 browse (chlor_a) file
    bl1map Generate projected L1A HDF file
    bl2map Generate projected L2 HDF file
    bl3map Generate projected L3 HDF file
    l0regen_seawifs Generate L0 file from L1A (HRPT) file

    SeaWiFS Data Extraction and Quality Control Programs:
    l1aextract_seawifs L1A and L2 file extraction
    register L1A coastline registration and warping


    MODIS Data Product Generation Programs:
    l1agen_modis Generate L1A file from L0 (PDS) file
    l1bgen_modis Generate L1B file from an L1A and GEO file
    l2gen,4 Generate L2 file from L1B file
    l2bin/l3bin Generate L3 space- or time-binned files from L2 files
    smigen Generate L3 SMI standard mapped product from L3 binned data

    l2gen

    Description: This program performs Level-2 processing on MODIS, SeaWiFS, OCTS, or CZCS data and generates Level-2 geophysical products by applying atmospheric corrections and bio-optical algorithms to the sensor data. The input data levels required for l2gen processing are as follows:

    • MODIS: input must be an Aqua or Terra L1B file
    • SeaWiFS: input may be either an L1A or L1B file
    • OCTS: input must be either a NASDA-format L1B file or SIMBIOS-format L1B file
    • CZCS: input must be a CZCS L1B file

    For a thorough description of the full capabilities of l2gen and details on the UNIX command-line user interface, please refer to the L2GEN User's Guide.

    Please read more about l2gen..

    Level-2 Products Selection Window:


    Description: This window allows the user to select Level-2 output products for the output file specified in the l2gen main window.

    **************************************** download SeaDAS****************************

    SeaDAS 5.3 released

    MODISL1DB 1.5 released


    Wednesday, March 25, 2009

    SeaWIFS/MODIS data download

    SeaWIFS/MODIS data download

    SeaWIFS Background

    The purpose of the Sea-viewing Wide Field-of-view Sensor (SeaWiFS) Project is to provide quantitative data on global ocean bio-optical properties to the Earth science community. Subtle changes in ocean color signify various types and quantities of marine phytoplankton (microscopic marine plants), the knowledge of which has both scientific and practical applications. The SeaWiFS Project will develop and operate a research data system that will process, calibrate, validate, archive and distribute data received from an Earth-orbiting ocean color sensor.
    (http://oceancolor.gsfc.nasa.gov/SeaWiFS/BACKGROUND/SEAWIFS_BACKGROUND.html)
    -------------------------------------------------------------------------------------------------

    Topic Announcements / Ocean Color Announcements / SeaWiFS Data Available for Download from (http://oceancolor.gsfc.nasa.gov/forum/oceancolor/topic_show.pl?tid=85)

    By @gene Date 2004-05-04 20:20

    1) seawifs data now available from the oceancolor web

    although it has taken a little longer than we had initially thought, we are
    happy to announce that it is now possible to download and/or order seawifs data
    (up to data collected 14 days ago, the required embargo period) directly from
    the oceancolor web browser along with the modis/aqua data that is currently
    being provided. this service is provided in addition to the continuing access
    and user services for seawifs data that are provided by the goddard daac.

    2) you still need to be an authorized seawifs user

    as with data access from the daac, you must be an authorized seawifs data
    user and have a password. for those of you who already are authorized users,
    just request a password directly from a link in the lower right portion
    on the oceancolor web page ( http://oceancolor.gsfc.nasa.gov ) to use this
    option. if you are not currently an authorized researcher, there is also a
    link on that web page that you can use to request to become one.

    upon authorization, new users will be provided with a password. if you
    are not sure if you are on the authorized list or if you want to verify the
    e-mail address at which you are listed at (information that we require),
    you can check at:

    http://daac.gsfc.nasa.gov/CAMPAIGN_DOCS/OCDST/SeaWiFS_auth.html

    3) improved seawifs 1 kilometer data product available

    we are currently producing an improved high resolution seawifs data product
    (MLAC = Merged Local Area Coverage) derived from the 1 kilometer seawifs
    hrpt and recorded lac data that reduces geographic overlap from multiple
    receiving stations and maximizes data quality. both level-1 and level-2 data
    are available for this new data set along with the same products derived
    from the gac (4 kilometer) data. we are currently processing the entire
    MLAC archive to create a complete set of level-1 and level-2 products and
    the entire mission should be available by early next week. currently,
    1997 is online with 1998 and the rest of the mission following close behind.

    4) geographic subsetting for seawifs data

    in addition to being able to order the full level-1 and level-2 files,
    you can also now request a geographic extract from the full sized file to
    only get the data for your specific region of interest. this option only
    works through the order and ftp option (rather than the direct download from
    the web browser which provides you with the entire file). once you've used
    the browser to find all the potential files for the time frame and general
    region of interest and hit the button, you'll be given the option
    of extracting the data products into a smaller geographic box. it will be
    these extracts (all fully supported in seadas) that will be staged for you
    to download.

    5) updated seawifs calibration model

    the seawifs data that you can get from the oceancolor web is slightly
    different from the data archived at the goddard daac in that we have
    switched to a revised calibration table which better handles the temporal
    degradation of the instrument in the very early and later parts of the mission.
    a comprehensive description of this change in the level-1 calibration can be
    found under the "validation" section of the oceancolor web. our analyses
    show that the differences are relatively minor which is why we did not
    believe it necessary to replace all the data that are currently archived
    at the daac based on reprocessing #4 at this time. as was discussed at the
    recent science team meeting, we anticipate an official reprocessing of the
    entire seawifs mission either later this year or early next which will most
    likely include a number of additional parameters based on the recommendations
    of the ocean color community.

    6) help available

    for those of you who are not familiar with all the functions of the oceancolor
    web browse and order tool, there is an extensive help function available.
    we will be keeping our eyes on the oceancolor forum for feedback and questions
    regarding this new feature.

    -----------------------------------end--------------------------------------------

    To download SeaWIFS/MODIS Data from OceanColor, you may click this link/url :
    http://oceancolor.gsfc.nasa.gov/cgi/browse.pl?sen=am

    best regards,
    Aji Putra Perdana
    http://ajiputrap.blogspot.com/
    http://gisresetutor.blogspot.com/

    Thursday, January 15, 2009

    MODIS phytoplankton-ENVI

    MODIS phytoplankton-ENVI

    I would like to discuss about "MODIS phytoplankton-ENVI".
    title of this my blog post today is about Aqua/Terra MODIS image processing for detecting phytoplankton using software ENVI.

    Let's start this discussion from the last word :"ENVI"

    What is ENVI??

    1. ENVI
    We know that ENVI is great image processing and analyzing geospatial imagery.
    ENVI is the premier software solution for processing and analyzing geospatial imagery used by GIS professionals, scientists, researchers, and image analysts around the world. ENVI software combines the latest spectral image processing and image analysis technology with an intuitive, user-friendly interface to help you get meaningful information from imagery.

    ENVI provides us MODIS Toolkit and Ocean Color Plug-ins (previous posting : http://ajiputrap.blogspot.com/2008/12/modis-toolkit-and-ocean-color-plug-ins.html)
    ENVI help us in MODIS image processing with geometric correction (bow-tie correction).

    - I have uploaded in my esnips simple tutorial Aqua/Terra MODIS image processing using ENVI 4.x

    http://ajiputrap.blogspot.com/2009/01/pengolahan-citra-aquaterra-modis-dengan.html

    download this tutorial:
    pengolahan citra modis dengan envi.pdf
    -- step by step from open MODIS HDF (Level 1B), MODIS Geometric Correction (include Bow-Tie Correction), Radiometric Correction for Reflectance and Radiance Bands (use Band Math).
    Another tutorial files can be downloaded in http://www.esnips.com/web/perdana09-article :
    - SeaDAS_4_AquaMODIS.pdf
    Tutorial Aqua/Terra MODIS image processing using SeaDAS software
    - Langkah Order Citra MODIS.pdf
    How to order MODIS (level 1B at Ladsweb)

    2. phytoplankton
    phytoplankton ??
    Phytoplankton are the autotrophic component of the plankton community. The name comes from the Greek words phyton, or "plant", and πλαγκτος ("planktos"), meaning "wanderer" or "drifter".[1] Most phytoplankton are too small to be individually seen with the unaided eye. However, when present in high enough numbers, they may appear as a green discoloration of the water due to the presence of chlorophyll within their cells (although the actual color may vary with the species of phytoplankton present due to varying levels of chlorophyll or the presence of accessory pigments such as phycobiliproteins, xanthophylls, etc.).

    Phytoplankton obtain energy through a process called photosynthesis and must therefore live in the well-lit surface layer (termed the euphotic zone) of an ocean, sea, lake, or other body of water.

    Phytoplankton are a key food item in both aquaculture and mariculture. Both utilize phytoplankton for the feeding of the animals being farmed. In mariculture, the phytoplankton is naturally occurring and is introduced into enclosures with the normal circulation of seawater. In aquaculture, phytoplankton must be obtained and introduced directly.

    References

    1. ^ Thurman, H. V. (1997). Introductory Oceanography. New Jersey, USA: Prentice Hall College. ISBN 0132620723.
    2. ^ "Satellite Sees Ocean Plants Increase, Coasts Greening". NASA (2 March 2005). Retrieved on 12 January 2009.
    3. ^ Richtel, M. (May 1, 2007), "Recruiting Plankton to Fight Global Warming", New York Times, http://www.nytimes.com/2007/05/01/business/01plankton.html?ref=science
    4. ^ Hallegraeff, G.M. (2003). Harmful algal blooms: a global overview. in Hallegraeff, G.M., Andewrson, D.M. and Cembella, A.D. (eds) 2003. Manual on Harmful Marine Microalgae. UNESCO, Paris
    5. ^ G.E. Hutchinson (1961). "The paradox of the plankton". Am. Nat. 95: 137–145. doi:10.1086/282171.
    6. ^ a b c d McVey, James P., Nai-Hsien Chao, and Cheng-Sheng Lee. CRC Handbook of Mariculture Vol. 1 : Crustacean Aquaculture. New York: C R C P LLC, 1993.

    == source information : http://en.wikipedia.org/wiki/Phytoplankton ==

    interesting question about phyto...

    Where Are Phytoplankton?

    The distribution of phytoplankton in the ocean have been measured by special instruments in space since 1979. The instruments, called ocean-color scanners, measure the color of the ocean. Color is proportional to the amount of chlorophyll pigments close to the surface, except in sediment-rich water very close to coasts. And the amount of chlorophyll is proportional to the amount of phytoplankton in the water. Water with great numbers of phytoplankton are green. Pure ocean water is deep navy blue.

    The first ocean-color scanner, the Coastal Zone Color Scanner, was launched on the Nimbus-7 satellite in 1978. It was followed many years later by SeaWiFS (Sea-viewing Wide Field-of-view Sensor) on the Seastar satellite launched in 1997. The most recent color scanner is 
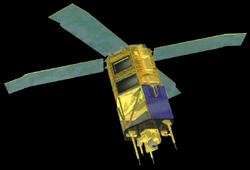
MODIS (Moderate Resolution Imaging Spectrometer) on the Terra spacecraft launched in 1999 and the Aqua satellite launched in 2002.

    more information about distribution of phyto...read this article : Distribution of Plankton

    summary from the article
    :
    Phytoplankton are abundant in regions where:
    1. Winds are able to mix nutrients up into near surface waters from deeper in the ocean, or
    2. Where Ekman transports driven by the winds pulls water up from deeper in the ocean,
    a. When winds blow toward the equator along west coasts of continents, and
    b. When the average winds blowing at different speeds and directions cause divergence of the Ekman transports,provided a small amount iron needed by the protists is in the water.

    --- MODIS (Moderate Resolution Imaging Spectrometer) on the Terra spacecraft and the Aqua satellite help us daily in monitoring or detecting phytoplankton. ---

    3. MODIS (Moderate Resolution Imaging Spectrometer)
    please read previously article about MODIS (http://ajiputrap.blogspot.com/search/label/MODIS)
    or directly from http://modis.gsfc.nasa.gov

    ===================================================================================
    Step by step Aqua/Terra MODIS (Level 1B) image processing using ENVI 4.2 software:
    1. Download MODIS data level 1B 1km resolution from ladsweb...
    2. Open HDF MODIS in ENVI 4.x
    File -> Open External File -> Generic Format -> HDF (http://ajiputrap.blogspot.com/2008/12/modis-hdf-hierarchical-data-format.html or http://ajiputrap.blogspot.com/search/label/HDF)
    3. Geometric Correction, include Bow-Tie Correction*
    Bowtie Correction aims to improve image at overlapped data. Overlap occurs because there is increasing instantaneous field of view (IFOV) of 1x1 km in the lowest point (nadir). Being close to almost 2 x 5 km at the maximum scan angle is 55 degree.
    After MODIS DATA geometrically corrected, then go to the next step
    4. Radiometric Correction
    Radiometric Correction in ENVI use Band Math (ENVI main menu, choose Basic Tool -> Band Math)

    Reflectance Bands calculated for visible and thermal infrared (1 – 19 and 26 bands) with this formula:
    Refb = Ref_Scaleb * (Bb - Ref_offsetsb)

    where: Refb = Reflectance of band- b
    Ref_Scaleb = Reflectance scale
    Bb = Band -b
    Ref_offsetsb = Reflectance offset band- b

    -- information about reflectance scale and offset we may get it from HDF Dataset (http://ajiputrap.blogspot.com/2008/12/modis-hdf-hierarchical-data-format.html or http://ajiputrap.blogspot.com/search/label/HDF)

    5. Chlorophyll-a algorithm with Band Math
    After we get geometric and radiometrically corrected MODIS image, we continue to the main step : detecting Chlorophyll-a

    Fitoplankton that is on a layer of light contains Chlorophyll-a useful for photosynthesis. Chlorophyll-a able to absorb a light blue and green, so it can detect the existence fitoplankton based on the ability of these Chlorophyll-a.

    MODIS can help us to detecting Chlorophyll-a (Chlor-a) with formula or algorithm from Carder et al. :

    Chlor-a=(10^(0.2818-(2.783*alog10(B10/B12))+(1.863*((alog10(B10/B12))^2))-
    (2.387*((alog10(B10/B12))^3))))

    where : B10 = Reflecance of Band 10
    B12 = Reflecance of Band 12
    - above is the formula of Chlor-a in Band Math of ENVI.

    In addition Chlorophyll-a , we may use sea surface temperature from MODIS to get information distribution of phytoplankton in the ocean. if we combined both we may get great information...

    ==================================================================================
    nice to share :)


    Best Regards,

    Aji Putra Perdana

    Monday, December 29, 2008

    MODIS Toolkit and Ocean Color Plug-ins from ENVI

    MODIS Toolkit and Ocean Color Plug-ins from ENVI*


    What is ENVI?

    ENVI is the premier software solution for processing and analyzing geospatial imagery used by GIS professionals, scientists, researchers, and image analysts around the world. ENVI software combines the latest spectral image processing and image analysis technology with an intuitive, user-friendly interface to help you get meaningful information from imagery.

    -------------------------------------------------------------------------------------
    Toolkits & Plugins
    Quickly and easily access toolkits and plug-ins that will empower your IDL and ENVI applications. Each listing here includes code samples and documentation to help you jump start your programming or application development.

    The MODIS Conversion Toolkit


    The MODIS Conversion Toolkit (MCTK) is plugin for ENVI that can ingest, process, and georeference every known MODIS product (currently 143) through your choice of an easy-to-use interactive widget interface or a fully-accessible programmatic interface.
    Download >

    ENVI Plugin for Ocean Color (EPOC)


    EPOC is an HDF file conversion, reprojection, and georeferencing utility for data sets that are currently distributed through the OceanColor web site or created using the SeaWiFS Data Analysis System.
    Download > Documentation >

    source information : http://www.ittvis.com/DownloadsHome/toolkits.aspx

    Wednesday, December 3, 2008

    Citra Aqua/Terra MODIS - Pengolahan Citra

    MODIS (or Moderate Resolution Imaging Spectroradiometer) is a key instrument aboard the Terra (EOS AM) and Aqua (EOS PM) satellites.

    The MODIS instrument is operating on both the Terra and Aqua spacecraft. It has a viewing swath width of 2,330 km and views the entire surface of the Earth every one to two days. Its detectors measure 36 spectral bands between 0.405 and 14.385 µm, and it acquires data at three spatial resolutions -- 250m, 500m, and 1,000m.

    Terra's orbit around the Earth is timed so that it passes from north to south across the equator in the morning, while Aqua passes south to north over the equator in the afternoon. Terra MODIS and Aqua MODIS are viewing the entire Earth's surface every 1 to 2 days, acquiring data in 36 spectral bands, or groups of wavelengths (see MODIS Technical Specifications).

    These data will improve our understanding of global dynamics and processes occurring on the land, in the oceans, and in the lower atmosphere. MODIS is playing a vital role in the development of validated, global, interactive Earth system models able to predict global change accurately enough to assist policy makers in making sound decisions concerning the protection of our environment.

    MODIS Technical Specifications :
    http://modis.gsfc.nasa.gov/about/specifications.php

    The many data products derived from MODIS observations describe features of the land, oceans and the atmosphere that can be used for studies of processes and trends on local to global scales.

    MODIS Level 1 data, geolocation, cloud mask, and Atmosphere products: http://ladsweb.nascom.nasa.gov/
    MODIS land products: http://edcdaac.usgs.gov/dataproducts.asp
    MODIS cryosphere products:http://nsidc.org/daac/modis/index.html
    MODIS ocean color and sea surface temperature products: http://oceancolor.gsfc.nasa.gov/

    source information :
    http://modis.gsfc.nasa.gov/
    http://ajiputrap.blogspot.com/2008/07/aquaterra-modis.html

    ----------------------------------------------------------------------------------------
    Langkah-langkah order citra MODIS bisa buat bebaca, silahkan di download di langkah order modis

    ----------------------------------------------------------------------------------------
    Aqua/Terra MODIS Image Processing

    Pemrosesan citra satelit digital untuk Aqua/Terra MODIS untuk kajian penginderaan jauh kelautan, dalam hal ini misalnya perolehan suhu permukaan laut (sea surface temperature) dan klorofil bisa memanfaatkan Software Open Source "SeaDAS".

    "The SeaWiFS Data Analysis System (SeaDAS) is a comprehensive image analysis package for the processing, display, analysis, and quality control of ocean color data."

    -- ulasan mengenai SeaDAS : http://ajiputrap.blogspot.com/search/label/SeaDAS "

    Sekarang software SeaDAS ini sudah sampai versi SeaDAS 5.2

    More information about SeaDAS, silahkan kunjungi websitenya : http://oceancolor.gsfc.nasa.gov/seadas/

    -- Pertama kali mengetahui tentang SeaDAS sewaktu mengikuti pelatihan di BROK (Biro Riset Observasi Kelautan) DKP / SeaCORM di Perancak Bali oleh Bu Retno Andiastuti --
    Thanks alot to Pak Realino for invite and allow me to joint the training..
    Thanks to Mrs. Retno Andiastuti and assistant (P3TISDA- BPPT) so i could finish my study and know about SeaDAS..
    Thanks to all Perancak teams...
    - disitulah kali pertama ku bersentuhan dengan SeaDAS,MODIS, Argo Float Data, NOAA-AVHRR yang membuatku bisa bergelar :) -

    Sewaktu pelatihan sama sekali ku ga bersentuhan dengan erat secara langsung dengan software SeaDAS, karena saat itu hanya satu komputer yang digunakan dan kita hanya melihat pemrosesan yang dilakukan sekaligus teori/konsep penjelasan, serta praktis yang diberikan.
    Diterangkan oleh bu Retno Andiastuti dengan cukup jelas dan dipraktekkan oleh asistennya..maaf saya lupa namanya...hehe (harap dimaklumi..)

    Sewaktu mau pulang ke kampung (jogja...hehe), sempat saya mengkopi master software SeaDAS tersebut...alangkah senangnya hati ini..thanks to asisten bu Retno :)

    Unfortunately, CD master linux Fedora Core 2 dan SeaDAS 4.8 (klo tidak salah...)...rusak semua :(...hiks-hiks...
    bersedihlah sudah hati ini....

    Finally, perburuan mulai dilakukan di dunia maya, mencari SeaDAS...
    di dunia rental perburuan CD Linux Fedora Core 2 juga dilakukan...

    Setelah berhasil,,,memulailah dengan instalasi Linux dan SeaDAS (dengan berbekal ingatan seadanya...maklum di Perancak tidak menyentuh keduanya dengan erat), dibantu dengan manual instalasi SeaDAS yang ditelaah berkat bantuan dosen..
    Akhirnya dengan sukses lah SeaDAS tlah ku instal..
    Next step...tahap download citra MODIS, dulu downloadnya bukan di ladsweb...udah lupa aku namanya,,hehe, selanga beberapa waktu baru karena mungkin kapasitas data yang besar dan sebagainya dipindahlah ke ladsweb.

    ---my next step....

    Kemudian ku diminta menuliskan seadanya mengenai pengolahan Aqua/Terra MODIS dengan SeaDAS, kebetulan saat itu ada pekerjaan untuk pengolahan data MODIS untuk kajian kelautan yakni penentuan lokasi potensi keberadaan ikan berdasarkan dari suhu permukaan laut dan klorofil.

    --- silahkan downlad tulisan sederhana pengolahan aqua modis dengan software SeaDAS -

    modul seadas for modis

    ------------------------------------- another image prosessing for MODIS ------------

    Selain menggunakan software open source (alias ga berbayar),.,,pengolahan citra Aqua/Terra MODIS juga bisa menggunakan software pengolahan citra digital yang berbayar, dalam hal ini menggunakan ENVI 4.x.

    Jadul (jaman dulu), sempat bingung dana bermain-main untuk transformasi data dari SeaDAS, ke ermapper, lalu envi...wach,,sok ribet tenan....hehe

    Kala itu, digunakan ENVI 4.0 dimana dalam software tersebut masih membutuhkan tools tambahan yakni berupa MODIS TOOLS untuk membantu dalam koreksi bow-tie, bahkan juga untuk load radiance and brightness temperature values.

    ---

    MODIStools for ENVI

    Modistools - add-in library for ENVI for work with the first levels MODIS data (i.e. MOD01-MOD02). This module contains functions that let to do following operations:

    * correct loaded image bands for bow-tie distortions,
    * create standard ENVI GCP file for image-to-map warping,
    * load radiance and brightness temperature values into available bands

    This library is available for free and may be downloaded from this site. See included text file for installation and usage notes.
    modistools_envi.v10.zip (15kB) MODISTools ENVI add-on
    ---

    Namun kini di ENVI di atas versi 4.0, koreksi bow-tie sudah digabungkan ke dalam georeference MODIS.

    ------------------------------------------------------------------------------

    Salam,

    Aji Putra Perdana
    - sok ocean sok tenan -

    Thursday, September 4, 2008

    SeaWIFS kembali mengamati bumi

    Setelah lama tidak melihat situsnya Oceancolor homepage, kemarin sore ku buka,mata langsung tertuju dengan sebuah kata yakni SeaWIFS yang kembali memonitor rumah kita (bumi)...waow...
    Satelit SeaWIFS telah kembali beroperasi normal kembali dan ini sungguh kabar yang sangat menggembirakan bagi masyarakat penginderaan jauh pada umumnya dan terutama yang senang mengamati bumi :).


    gambar di atas adalah satelit SeaWIFS

    SeaWiFS stands for Sea-viewing Wide Field-of-view Sensor. It is the only scientific instrument on GeoEye's OrbView-2 (AKA SeaStar) satellite, and was a follow-on experiment to the Coastal Zone Color Scanner on Nimbus 7. Launched August 1, 1997 on an Orbital Sciences Pegasus small air-launched rocket, the instrument began scientific operations on 18 September 1997. The sensor resolution is 1.1 km (LAC), 4.5 km (GAC). The sensor records information in the following optical bands:
    Band Wavelength
    1 402-422 nm
    2 433-453 nm
    3 480-500 nm
    4 500-520 nm
    5 545-565 nm
    6 660-680 nm
    7 745-785 nm
    8 845-885 nm

    The instrument has been specifically designed to monitor ocean characteristics such as chlorophyll-a concentration and water clarity. The instrument is able to tilt up to 20 degrees to avoid sunlight from the sea surface. This feature is important at equatorial latitudes where glint from sunlight often obscures water colour.

    sumber : http://en.wikipedia.org/wiki/SeaWiFS

    Berikut sebuah tulisan dari situs oceancolor mengenai kembalinya SeaWIFS :

    SeaWiFS Returns to Monitoring Our Home


    We are so happy to report that after many months of hard work on the part of the folks at GeoEye, Orbital Sciences and NASA, SeaWiFS has been returned to normal operations as of yesterday, and, from what we have been able to tell so far from the imagery and telemetry, all systems are performing as they should and hopefully, this will be the resumption of a long and incredibly valuable data set. Thanks to everyone involved for their efforts on getting us back.

    The above image shows Tropical Storm Fay and the eastern U.S. on August 20, 2008 while a more global perspective shows what other regions looked like on the same day.


    untuk melihat-lihat gambar-gambar hasil rekaman satelit yang ada di situs oceancolor : Image Gallery