Showing posts with label chlorophyll. Show all posts

Wednesday, December 8, 2010

(Citra-Ocen Color Galeri) Fenomena Upwelling di Pesisir

(Citra-Ocen Color Galeri) Fenomena Upwelling di Pesisir

Melihat wilayah pesisir, tentusaja hal yang biasa bagi kita yang tinggal di Negara Maritim, Negara Kepulauan dengan garis pantai 81.000 km dan termasuk katergori yang terpanjang garis pantainya. Tidak ada salahnya kita menatap fenomena-fenomena pesisir di wilayah sono...salah satunya kali ini ditampilkan fenomena upwelling yang terjadi di wilayah pesisir barat Amerika sono, bukan Ameriki sini. Mengambil dari galeri gambar (citra satelit) oceancolor dalam kategori citra pesisir (coastal images).

Gambar 1. Wilayah Pesisir Barat Amerika Serikat

Angin bertiup ke selatan di sepanjang pantai barat Amerika Serikat - karena gesekan dan pengaruh rotasi bumi (friction and the effect of Earth's rotation) - menyebabkan lapisan permukaan lautan bergerak menjauh dari pantai. Karena air permukaan bergerak lepas pantai, dingin, air yang kaya nutrisi naik ke atas (upwells) dari bawah untuk menggantinya. Ini merupakan fenomena upwelling yang mengisi pertumbuhan fitoplankton laut, bersama dengan rumput laut yang lebih besar, pada gilirannya memelihara keragaman yang luar biasa makhluk yang ditemukan di sepanjang pantai California utara dan tengah.


Sensor seperti SeaWiFS bisa "melihat" efek dari ini produktivitas upwelling-terkait, karena fitoplankton klorofil-bantalan memantulkan kembali cahaya berwarna hijau ke ruang angkasa sebagai lawan dari air itu sendiri yang mencerminkan panjang gelombang dominan biru kembali ke angkasa.

Wilayah Laut dari gambar (citra) di atas (dikumpulkan pada tanggal 6 Oktober 2002) adalah kode warna untuk menunjukkan konsentrasi klorofil. Wilayah daratan dan kumpulan awan pada bagian dari gambar (citra) disajikan dalam komposit warna kuasi-alami (quasi-natural color).

--- Upwelling : fenomena di lautan yang begitu dingin, begitu kaya dan membawa kehidupan, demikian ungkap ANNE CANRIGHT, seorang geograf/geografer, penulis dan fotograf/fotografer, serta editor untuk Coast & Ocean. ---


sumber : Ocean Color Image Gallery dan http://www.ocean98.org

salam 'pesisir',

Aji PP

Sunday, December 5, 2010

Mangrove di INDONESIA (yang kaya sumberdaya)

Mangrove di INDONESIA (yang kaya sumberdaya)

Secara disengaja, hari ini fulan berkunjung ke http://earthobservatory.nasa.gov/IOTD/ untuk melihat image of d-day. Muncullah sebuah Negara Kepulauan sebagai salah satu dalam tampilan image of d-day yakni INDONESIA. Jadi teringat akan tulisan pembuka yang kerapkali digunakan oleh para peneliti, penulis, akademisi dan lain sebagainya untuk membuka pembicaraan atau tulisan mengenai sumberdaya kelautan dan permasalahannya di Indonesia yakni bahwa INDONESIA merupakan negara Maritim, Kepulauan, Kelautan, dan lain sebagainya dimana 70% wilayahnya berupa lautan, membentang 81.000 km garis pantainya dan lain sebagainya lagi dan lagi.

Sungguh luar biasa potensi Negera Kesatuan Republik Indonesia ini coba bayangkan betapa dunia menatap kita (baca: sumberdaya alam). Betapa butuhnya dunia akan INDONESIA terkait pula perubahan iklim yang kain digembor-gemborkan.

Apakah salah satu sumberdaya kelautan itu?

Mangrove, jawab fulan.

Kawasan hutan mangrove di Indonesia telah menyusut dari 4,2 juta hektar pada tahun 1982 sampai 2 juta hektar, ujar sebuah LSM (dimuat di dalam The Jakarta Post 6 Desember 2010).

"Sekitar 70 persen hutan mangrove di Indonesia berada dalam kondisi kritis dan rusak berat," kata Menteri Kelautan dan Perikanan RI Bapak Fadel Muhammad ketika meluncurkan kampanye penanaman bakau di desa Poka, Kecamatan Teluk Ambon, Provinsi Maluku, Jumat (30 Juli 2010). Dimuat di dalam Antara News pada hari sabtu 31 Juli 2010.

" Rawa bakau dapat membantu masyarakat pantai di Indonesia dalam menangkis laut yang naik/meningkat dan badai tropis kuat yang disebabkan oleh perubahan iklim," ujar para ahli yang dimuat dalam Reuters.

The Jakarta Post menuliskan :

RI’s mangrove forests shrinks to 2 million ha


Antara News menuliskan :


Reuters menuliskan :

Ketiga tulisan tersebut adalah sumber-sumber yang dipergunakan dalam tulisan ringkas di situs NASA yang memuat gambar persebaran Mangrove di dunia dan Indonesia. Berikut referensi yang dipergunakan, jika ada yang tertarik membacanya secara langsung silahkan meluncur ke TKP.
  1. Antara News (2010, July 31). Minister: Indonesia`s mangroves in critical condition.Accessed November 29, 2010.

  2. Giri, C., Ochieng, E., Tieszen, L. L., Zhu, Z., Singh, A., Loveland, T., Masek, J. and Duke, N. (2010) Status and distribution of mangrove forests of the world using earth observation satellite data. Global Ecology and Biogeography, DOI: 10.1111/j.1466-8238.2010.00584.x.
  3. The Jakarta Post (2010, March 21). RI’s mangrove forests shrinks to 2 million ha.Accessed November 29, 2010.
  4. MangroveWatch (n.d.) Mangroves in Australia. Accessed November 29, 2010.
  5. Landsat at NASA (2010, August 18). Landsat Enables World’s Most Comprehensive Mangrove Assessment. Accessed November 29, 2010.
  6. Reuters (2007, December 6). Mangroves help Indonesia fend off climate change.Accessed November 29, 2010.
Memetakan Mangrove dari Satelit, demikian judul yang diusung oleh NASA dalam image of d-day untuk postingan 30 November 2010.

Gambar (Peta) Persebaran Mangrove di Indonesia berdasarkan citra satelit

Mapping Mangroves by Satellite
download large image (430 KB, PNG)

Usaha pembuatan peta ini dipimpin oleh Chandra Giri dari U.S. Geological Survey dan dipublikasikan baru-baru ini di dalam Jurnal Global Ecology and Biogeography. Menggunakan teknik klasifikasi citra dijital, tim peneliti melakukan kompilasi dan analisa lebih dari 1000 scenes satelit kumpulan Landsat series.


*tambahan info (update info) : kata temen yang ndijit mangrove di Bakosurtanal; luas Mangrove di Indonesia 3,2 juta*

+ sekedar berbagi+

Salam,
Aji PP

Wednesday, March 25, 2009

SeaWIFS/MODIS data download

SeaWIFS/MODIS data download

SeaWIFS Background

The purpose of the Sea-viewing Wide Field-of-view Sensor (SeaWiFS) Project is to provide quantitative data on global ocean bio-optical properties to the Earth science community. Subtle changes in ocean color signify various types and quantities of marine phytoplankton (microscopic marine plants), the knowledge of which has both scientific and practical applications. The SeaWiFS Project will develop and operate a research data system that will process, calibrate, validate, archive and distribute data received from an Earth-orbiting ocean color sensor.
(http://oceancolor.gsfc.nasa.gov/SeaWiFS/BACKGROUND/SEAWIFS_BACKGROUND.html)
-------------------------------------------------------------------------------------------------

Topic Announcements / Ocean Color Announcements / SeaWiFS Data Available for Download from (http://oceancolor.gsfc.nasa.gov/forum/oceancolor/topic_show.pl?tid=85)

By @gene Date 2004-05-04 20:20

1) seawifs data now available from the oceancolor web

although it has taken a little longer than we had initially thought, we are
happy to announce that it is now possible to download and/or order seawifs data
(up to data collected 14 days ago, the required embargo period) directly from
the oceancolor web browser along with the modis/aqua data that is currently
being provided. this service is provided in addition to the continuing access
and user services for seawifs data that are provided by the goddard daac.

2) you still need to be an authorized seawifs user

as with data access from the daac, you must be an authorized seawifs data
user and have a password. for those of you who already are authorized users,
just request a password directly from a link in the lower right portion
on the oceancolor web page ( http://oceancolor.gsfc.nasa.gov ) to use this
option. if you are not currently an authorized researcher, there is also a
link on that web page that you can use to request to become one.

upon authorization, new users will be provided with a password. if you
are not sure if you are on the authorized list or if you want to verify the
e-mail address at which you are listed at (information that we require),
you can check at:

http://daac.gsfc.nasa.gov/CAMPAIGN_DOCS/OCDST/SeaWiFS_auth.html

3) improved seawifs 1 kilometer data product available

we are currently producing an improved high resolution seawifs data product
(MLAC = Merged Local Area Coverage) derived from the 1 kilometer seawifs
hrpt and recorded lac data that reduces geographic overlap from multiple
receiving stations and maximizes data quality. both level-1 and level-2 data
are available for this new data set along with the same products derived
from the gac (4 kilometer) data. we are currently processing the entire
MLAC archive to create a complete set of level-1 and level-2 products and
the entire mission should be available by early next week. currently,
1997 is online with 1998 and the rest of the mission following close behind.

4) geographic subsetting for seawifs data

in addition to being able to order the full level-1 and level-2 files,
you can also now request a geographic extract from the full sized file to
only get the data for your specific region of interest. this option only
works through the order and ftp option (rather than the direct download from
the web browser which provides you with the entire file). once you've used
the browser to find all the potential files for the time frame and general
region of interest and hit the button, you'll be given the option
of extracting the data products into a smaller geographic box. it will be
these extracts (all fully supported in seadas) that will be staged for you
to download.

5) updated seawifs calibration model

the seawifs data that you can get from the oceancolor web is slightly
different from the data archived at the goddard daac in that we have
switched to a revised calibration table which better handles the temporal
degradation of the instrument in the very early and later parts of the mission.
a comprehensive description of this change in the level-1 calibration can be
found under the "validation" section of the oceancolor web. our analyses
show that the differences are relatively minor which is why we did not
believe it necessary to replace all the data that are currently archived
at the daac based on reprocessing #4 at this time. as was discussed at the
recent science team meeting, we anticipate an official reprocessing of the
entire seawifs mission either later this year or early next which will most
likely include a number of additional parameters based on the recommendations
of the ocean color community.

6) help available

for those of you who are not familiar with all the functions of the oceancolor
web browse and order tool, there is an extensive help function available.
we will be keeping our eyes on the oceancolor forum for feedback and questions
regarding this new feature.

-----------------------------------end--------------------------------------------

To download SeaWIFS/MODIS Data from OceanColor, you may click this link/url :
http://oceancolor.gsfc.nasa.gov/cgi/browse.pl?sen=am

best regards,
Aji Putra Perdana
http://ajiputrap.blogspot.com/
http://gisresetutor.blogspot.com/

Wednesday, February 25, 2009

Geospatial Imaging for Climate Change

Geospatial Imaging for Climate Change presented in Plenary Sessions : Geospatial Imaging Technologies and Sustainable Development
Map World Forum 2009 - February 10, 2009 HICC, Hyderabad, India

Dr Shailesh Nayak, Secretary
Ministry of Earth Sciences, Government of India, India

The changes in atmospheric concentration of green house gases and aerosols, in solar radiation and land surface properties have altered the energy balance of the climate system of the earth. The increase in green house gases is primarily due to fossil fuel use, land use changes and agriculture. In order to understand the causes of change and their likely impact, the observation needs to encompass atmosphere (cloud properties, radiative energy fluxes, precipitation, aerosol properties, wind, humidity, temperature, etc), atmospheric chemistry, solar radiation, land (land cover, land use changes, vegetation dynamics, soil moisture, etc), ocean (temperature, salinity, phytoplankton, sea surface wind, sea surface topography) and cryosphere (land ice, sea ice, snow cover). During the last thirty years, host of satellites have provided very useful data on many of the above mentioned parameters. Microwave radiometers and optical multispectral data have provided vital data on changes in ice cover on polar regions and glacier retreat on Himalayas. Altimeters provided data on sea-level-rise and on ocean circulation especially during the last fifteen years. Thermal radiometers provided data on rise of sea surface temperature. The growth and decay of ozone hole over the years has been monitored by satellites. It is necessary to evolve a measurement strategy (overlap, sampling, calibration and data continuity) to improve accuracy and scientific content for future satellites.

Thursday, January 22, 2009

MODIS (Aqua/Terra)-Image Processing (2)

MODIS (Aqua/Terra)-Image Processing (2)

continues from previous entry...http://ajiputrap.blogspot.com/modis-image-processing.html

" temperature brightness " or " temperature brightness value "

Aqua MODIS image processing for sea surface temperature using two bands : band 31 and band 32 (that have processed for corrected radiance value).
We need to convert radiance value both bands (31 and 32) to Brightness Value using “Planck”:

Tb = c2/(Vi * ln (c1/(Vi5 * radiance) + 1))
where Tb = Brightness Value (K),
c1 = Constanta radiance (1.1910659x10⁸ [W m -2sr-1 (µm-1 )-4 ])
c2 = Constanta radiance (1.438833 x 10⁴ [K µm])
Vi = central wavelength

below are table for central wavelength - Aqua/Terra MODIS Bands..

For AQUA MODIS =
Band 20 : 3.7803
Band 22 : 3.9720
Band 23 : 4.0617
Band 31 : 11.0263
Band 32 : 12.0424

For TERRA MODIS =
Band 22 : 3.9719
Band 23 : 4.0567
Band 31 : 11.0073
Band 32 : 12.0020

-----------------------------------------------------------------------------------

nice to share

Aji PP

Wednesday, January 21, 2009

MODIS (Aqua/Terra)-Image Processing (1)

MODIS (Aqua/Terra)-Image Processing (1)

this is just a little bit sharing... :)

you may or have been read :
http://ajiputrap.blogspot.com/search/label/Aqua
http://ajiputrap.blogspot.com/search/label/Aqua%2FTerra%20MODIS
http://ajiputrap.blogspot.com/search/label/MODIS

After we download MODIS (Aqua/Terra) Level 1B Radiance Calibrated (1KM, 500m and 250m, opr you just download 1KM only (its already consist of 250m and 500m that aggregated to 1km) and Level 1A Geolocation (for extracting LAND SEA MASK).

The next step is to open HDF MODIS data in Image Processing Software, such as ENVI...
in this post i would like to share about open HDF MODIS DATA, View HDF DATASETS and other steps in image processing using software ENVI 4.x.

1. In ENVI 4.x u may open HDF MODIS DATA through two ways:
a. Open HDF MODIS data from:
File -> Open External Files -> General Format -> HDF

U will see HDF Dataset Selection, and then choose Datasets (that to be opened)
Click OK
Choose BSQ and click OK (repeated until 4 times, depend on number of dataset opened)

b. Or u may open directly from
File -> Open Image File

Will open all modis data from MYD021KM: Reflectance and Radiance Bands (1- 19 and 26) also Emissive Bands (20-25 and 27-36)

Your MODIS DATA will opened in ENVI 4.x

2. View HDF Datasets of MODIS
from ENVI 4.x main menu..choose Basic Tools->Preprocessing->Data Specific Utilities -> View HDF Datasets Attributes
and then choose your MODIS DATA...
u can read my previous posting :
http://ajiputrap.blogspot.com/2008/12/modis-hdf-hierarchical-data-format.html

3. Radiometric Correction
Radiometric Correction in ENVI use Band Math (ENVI main menu, choose Basic Tool -> Band Math)

Radiance bands calculated using this formula :
Rb = R_scaleb ( SIb – R_offsetsb)
where :
Rb = Radiance of band-b
R_Scaleb = Radiance scale of band-b
SIb = Sign Integer of band-b
R_offset¬sb = Radiance offsets of band-b

Radiance value of sensor zenith calculated using this formula :
Rz = R_scalez * iz * pi/180
dimana :
Rz = Radiance value of sensor zenith
R_scalez = Radiance scale of sensor zenith
iz = Sensor zenith


Reflectance Bands calculated for visible and thermal infrared (1 – 19 and 26 bands) with this formula:

Refb = Ref_Scaleb * (Bb - Ref_offsetsb)

where: Refb = Reflectance of band- b
Ref_Scaleb = Reflectance scale
Bb = Band -b
Ref_offsetsb = Reflectance offset band- b

4. applied formula or algorithm (for Sea Surface Temperature or Chlorophyll-a)

MODIS can help us to detecting Chlorophyll-a (Chlor-a) with formula or algorithm from Carder et al. :

Chlor-a=(10^(0.2818-(2.783*alog10(B10/B12))+(1.863*((alog10(B10/B12))^2))-
(2.387*((alog10(B10/B12))^3))))

where : B10 = Reflecance of Band 10
B12 = Reflecance of Band 12
- above is the formula of Chlor-a in Band Math of ENVI.

Aqua MODIS image processing for sea surface temperature using two bands : band 31 and band 32 (that have processed for corrected radiance value).
We need to convert radiance value both bands (31 and 32) to Brightness Value using “Planck”:

Tb = c2/(Vi * ln (c1/(Vi5 * radiance) + 1))
where Tb = Brightness Value (K),
c1 = Constanta radiance (1.1910659x10⁸ [W m -2sr-1 (µm-1 )-4 ])
c2 = Constanta radiance (1.438833 x 10⁴ [K µm])
Vi = central wavelength

You can use band math ENVI 4.x and put this formula:
(1.438833*10000)/(11.0263*(alog((1.1910659*100000000)/(11.0263^5*b31))/1))
where :
b31 = band 31
to determine or get information of Sea Surface Temperature you may use this algorithm from Brown and Minnet :
SPL =
1.152+0.96*(B1-273)+0.151*(B1-B2)*(B3-273)+2.021*(B1-B2)*(1/COS(B4)-1)

where
B1 = Brightness Value of band 31
B2 = Brightness Value of band 32
B3 = Brightness Value of band 20
B4 = Radiance Value of sensor zenith


=========
Regards,

Aji Putra Perdana

Thursday, January 15, 2009

MODIS phytoplankton-ENVI

MODIS phytoplankton-ENVI

I would like to discuss about "MODIS phytoplankton-ENVI".
title of this my blog post today is about Aqua/Terra MODIS image processing for detecting phytoplankton using software ENVI.

Let's start this discussion from the last word :"ENVI"

What is ENVI??

1. ENVI
We know that ENVI is great image processing and analyzing geospatial imagery.
ENVI is the premier software solution for processing and analyzing geospatial imagery used by GIS professionals, scientists, researchers, and image analysts around the world. ENVI software combines the latest spectral image processing and image analysis technology with an intuitive, user-friendly interface to help you get meaningful information from imagery.

ENVI provides us MODIS Toolkit and Ocean Color Plug-ins (previous posting : http://ajiputrap.blogspot.com/2008/12/modis-toolkit-and-ocean-color-plug-ins.html)
ENVI help us in MODIS image processing with geometric correction (bow-tie correction).

- I have uploaded in my esnips simple tutorial Aqua/Terra MODIS image processing using ENVI 4.x

http://ajiputrap.blogspot.com/2009/01/pengolahan-citra-aquaterra-modis-dengan.html

download this tutorial:
pengolahan citra modis dengan envi.pdf
-- step by step from open MODIS HDF (Level 1B), MODIS Geometric Correction (include Bow-Tie Correction), Radiometric Correction for Reflectance and Radiance Bands (use Band Math).
Another tutorial files can be downloaded in http://www.esnips.com/web/perdana09-article :
- SeaDAS_4_AquaMODIS.pdf
Tutorial Aqua/Terra MODIS image processing using SeaDAS software
- Langkah Order Citra MODIS.pdf
How to order MODIS (level 1B at Ladsweb)

2. phytoplankton
phytoplankton ??
Phytoplankton are the autotrophic component of the plankton community. The name comes from the Greek words phyton, or "plant", and πλαγκτος ("planktos"), meaning "wanderer" or "drifter".[1] Most phytoplankton are too small to be individually seen with the unaided eye. However, when present in high enough numbers, they may appear as a green discoloration of the water due to the presence of chlorophyll within their cells (although the actual color may vary with the species of phytoplankton present due to varying levels of chlorophyll or the presence of accessory pigments such as phycobiliproteins, xanthophylls, etc.).

Phytoplankton obtain energy through a process called photosynthesis and must therefore live in the well-lit surface layer (termed the euphotic zone) of an ocean, sea, lake, or other body of water.

Phytoplankton are a key food item in both aquaculture and mariculture. Both utilize phytoplankton for the feeding of the animals being farmed. In mariculture, the phytoplankton is naturally occurring and is introduced into enclosures with the normal circulation of seawater. In aquaculture, phytoplankton must be obtained and introduced directly.

References

1. ^ Thurman, H. V. (1997). Introductory Oceanography. New Jersey, USA: Prentice Hall College. ISBN 0132620723.
2. ^ "Satellite Sees Ocean Plants Increase, Coasts Greening". NASA (2 March 2005). Retrieved on 12 January 2009.
3. ^ Richtel, M. (May 1, 2007), "Recruiting Plankton to Fight Global Warming", New York Times, http://www.nytimes.com/2007/05/01/business/01plankton.html?ref=science
4. ^ Hallegraeff, G.M. (2003). Harmful algal blooms: a global overview. in Hallegraeff, G.M., Andewrson, D.M. and Cembella, A.D. (eds) 2003. Manual on Harmful Marine Microalgae. UNESCO, Paris
5. ^ G.E. Hutchinson (1961). "The paradox of the plankton". Am. Nat. 95: 137–145. doi:10.1086/282171.
6. ^ a b c d McVey, James P., Nai-Hsien Chao, and Cheng-Sheng Lee. CRC Handbook of Mariculture Vol. 1 : Crustacean Aquaculture. New York: C R C P LLC, 1993.

== source information : http://en.wikipedia.org/wiki/Phytoplankton ==

interesting question about phyto...

Where Are Phytoplankton?

The distribution of phytoplankton in the ocean have been measured by special instruments in space since 1979. The instruments, called ocean-color scanners, measure the color of the ocean. Color is proportional to the amount of chlorophyll pigments close to the surface, except in sediment-rich water very close to coasts. And the amount of chlorophyll is proportional to the amount of phytoplankton in the water. Water with great numbers of phytoplankton are green. Pure ocean water is deep navy blue.

The first ocean-color scanner, the Coastal Zone Color Scanner, was launched on the Nimbus-7 satellite in 1978. It was followed many years later by SeaWiFS (Sea-viewing Wide Field-of-view Sensor) on the Seastar satellite launched in 1997. The most recent color scanner is MODIS (Moderate Resolution Imaging Spectrometer) on the Terra spacecraft launched in 1999 and the Aqua satellite launched in 2002.

more information about distribution of phyto...read this article : Distribution of Plankton

summary from the article
:
Phytoplankton are abundant in regions where:
1. Winds are able to mix nutrients up into near surface waters from deeper in the ocean, or
2. Where Ekman transports driven by the winds pulls water up from deeper in the ocean,
a. When winds blow toward the equator along west coasts of continents, and
b. When the average winds blowing at different speeds and directions cause divergence of the Ekman transports,provided a small amount iron needed by the protists is in the water.

--- MODIS (Moderate Resolution Imaging Spectrometer) on the Terra spacecraft and the Aqua satellite help us daily in monitoring or detecting phytoplankton. ---

3. MODIS (Moderate Resolution Imaging Spectrometer)
please read previously article about MODIS (http://ajiputrap.blogspot.com/search/label/MODIS)
or directly from http://modis.gsfc.nasa.gov

===================================================================================
Step by step Aqua/Terra MODIS (Level 1B) image processing using ENVI 4.2 software:
1. Download MODIS data level 1B 1km resolution from ladsweb...
2. Open HDF MODIS in ENVI 4.x
File -> Open External File -> Generic Format -> HDF (http://ajiputrap.blogspot.com/2008/12/modis-hdf-hierarchical-data-format.html or http://ajiputrap.blogspot.com/search/label/HDF)
3. Geometric Correction, include Bow-Tie Correction*
Bowtie Correction aims to improve image at overlapped data. Overlap occurs because there is increasing instantaneous field of view (IFOV) of 1x1 km in the lowest point (nadir). Being close to almost 2 x 5 km at the maximum scan angle is 55 degree.
After MODIS DATA geometrically corrected, then go to the next step
4. Radiometric Correction
Radiometric Correction in ENVI use Band Math (ENVI main menu, choose Basic Tool -> Band Math)

Reflectance Bands calculated for visible and thermal infrared (1 – 19 and 26 bands) with this formula:
Refb = Ref_Scaleb * (Bb - Ref_offsetsb)

where: Refb = Reflectance of band- b
Ref_Scaleb = Reflectance scale
Bb = Band -b
Ref_offsetsb = Reflectance offset band- b

-- information about reflectance scale and offset we may get it from HDF Dataset (http://ajiputrap.blogspot.com/2008/12/modis-hdf-hierarchical-data-format.html or http://ajiputrap.blogspot.com/search/label/HDF)

5. Chlorophyll-a algorithm with Band Math
After we get geometric and radiometrically corrected MODIS image, we continue to the main step : detecting Chlorophyll-a

Fitoplankton that is on a layer of light contains Chlorophyll-a useful for photosynthesis. Chlorophyll-a able to absorb a light blue and green, so it can detect the existence fitoplankton based on the ability of these Chlorophyll-a.

MODIS can help us to detecting Chlorophyll-a (Chlor-a) with formula or algorithm from Carder et al. :

Chlor-a=(10^(0.2818-(2.783*alog10(B10/B12))+(1.863*((alog10(B10/B12))^2))-
(2.387*((alog10(B10/B12))^3))))

where : B10 = Reflecance of Band 10
B12 = Reflecance of Band 12
- above is the formula of Chlor-a in Band Math of ENVI.

In addition Chlorophyll-a , we may use sea surface temperature from MODIS to get information distribution of phytoplankton in the ocean. if we combined both we may get great information...

==================================================================================
nice to share :)


Best Regards,

Aji Putra Perdana

Monday, December 29, 2008

MODIS Toolkit and Ocean Color Plug-ins from ENVI

MODIS Toolkit and Ocean Color Plug-ins from ENVI*


What is ENVI?

ENVI is the premier software solution for processing and analyzing geospatial imagery used by GIS professionals, scientists, researchers, and image analysts around the world. ENVI software combines the latest spectral image processing and image analysis technology with an intuitive, user-friendly interface to help you get meaningful information from imagery.

-------------------------------------------------------------------------------------
Toolkits & Plugins
Quickly and easily access toolkits and plug-ins that will empower your IDL and ENVI applications. Each listing here includes code samples and documentation to help you jump start your programming or application development.

The MODIS Conversion Toolkit


The MODIS Conversion Toolkit (MCTK) is plugin for ENVI that can ingest, process, and georeference every known MODIS product (currently 143) through your choice of an easy-to-use interactive widget interface or a fully-accessible programmatic interface.
Download >

ENVI Plugin for Ocean Color (EPOC)


EPOC is an HDF file conversion, reprojection, and georeferencing utility for data sets that are currently distributed through the OceanColor web site or created using the SeaWiFS Data Analysis System.
Download > Documentation >

source information : http://www.ittvis.com/DownloadsHome/toolkits.aspx

Thursday, September 4, 2008

SeaWIFS kembali mengamati bumi

Setelah lama tidak melihat situsnya Oceancolor homepage, kemarin sore ku buka,mata langsung tertuju dengan sebuah kata yakni SeaWIFS yang kembali memonitor rumah kita (bumi)...waow...
Satelit SeaWIFS telah kembali beroperasi normal kembali dan ini sungguh kabar yang sangat menggembirakan bagi masyarakat penginderaan jauh pada umumnya dan terutama yang senang mengamati bumi :).


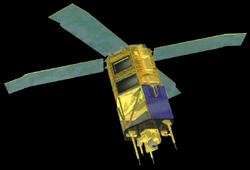
gambar di atas adalah satelit SeaWIFS

SeaWiFS stands for Sea-viewing Wide Field-of-view Sensor. It is the only scientific instrument on GeoEye's OrbView-2 (AKA SeaStar) satellite, and was a follow-on experiment to the Coastal Zone Color Scanner on Nimbus 7. Launched August 1, 1997 on an Orbital Sciences Pegasus small air-launched rocket, the instrument began scientific operations on 18 September 1997. The sensor resolution is 1.1 km (LAC), 4.5 km (GAC). The sensor records information in the following optical bands:
Band Wavelength
1 402-422 nm
2 433-453 nm
3 480-500 nm
4 500-520 nm
5 545-565 nm
6 660-680 nm
7 745-785 nm
8 845-885 nm

The instrument has been specifically designed to monitor ocean characteristics such as chlorophyll-a concentration and water clarity. The instrument is able to tilt up to 20 degrees to avoid sunlight from the sea surface. This feature is important at equatorial latitudes where glint from sunlight often obscures water colour.

sumber : http://en.wikipedia.org/wiki/SeaWiFS

Berikut sebuah tulisan dari situs oceancolor mengenai kembalinya SeaWIFS :

SeaWiFS Returns to Monitoring Our Home


We are so happy to report that after many months of hard work on the part of the folks at GeoEye, Orbital Sciences and NASA, SeaWiFS has been returned to normal operations as of yesterday, and, from what we have been able to tell so far from the imagery and telemetry, all systems are performing as they should and hopefully, this will be the resumption of a long and incredibly valuable data set. Thanks to everyone involved for their efforts on getting us back.

The above image shows Tropical Storm Fay and the eastern U.S. on August 20, 2008 while a more global perspective shows what other regions looked like on the same day.


untuk melihat-lihat gambar-gambar hasil rekaman satelit yang ada di situs oceancolor : Image Gallery

Monday, August 25, 2008

Aqua MODIS - SeaDAS

Pertanyaan ini saya peroleh dari seorang temen di Pontianak :)


1. apakah citra modis dapat digunakan untuk pencitraan SPL dan klorofil ?
jawab :

citra aqua modis dapat digunakan untuk SPL dan klorofil.
apabila menghendaki level 2 aqua modis SPL dan Klorofil tanpa melalui pengolahan atau dengan kata lain langsung download data level 2 nya dapat diperoleh di
http://oceancolor.gsfc.nasa.gov/cgi/browse.pl?sen=am

2. apakah citra modis dapat di download secara free n bagaimana caranya ?
jawab :

untuk citra level 2 oceancolor (SPL, Klorofil) bisa di download di http://oceancolor.gsfc.nasa.gov/cgi/browse.pl?sen=am

untuk level 1 bisa di download di http://ladsweb.nascom.nasa.gov/

3. bagaimanakah cara pengolahan citra modis untuk mengetahui SPL dan klorofil ?

jawab :

pengolahan citra modis untuk ekstraksi informasi SPL dan klorofil bisa menggunakan software SEaDAs yang free..

software bisa di unduh di http://oceancolor.gsfc.nasa.gov/seadas/


Maaf sebelumnya Pak..saya membalasnya via blog..soalnya ga da emailny :)


semoga bisa membantu :)

salam kenal,

Aji PP

Sunday, May 18, 2008

oceancolor_oneyear after tsunami..

pakabar teman2..

sembari iseng2 googling..
ku temui something interest for me..

waw...

One Year After the Indian Ocean Tsunami

"The MODIS Aqua ocean color image on 27 December 2004"


We saw over-estimated chlorophyll a at the northwestern Sumatra. Some tsunami victims were floating in the “high chlorophyll a” water waiting to be rescued.


One year after the tsunami….


Everything seems very peaceful in the ocean. But the survived tsunami victims are still waiting for the help and support from the international society.

"semua keliatan nyaman dan damai...akan tetapi...korban tsunami "masih menunggu" pertolongan...."


sumber : http://sg.geocities.com/myoceancolor/Oneyear_tsunami.htm